Time Tracking: Summer 2021
Published:
Introduction
It’s been almost half a year since my last post about tracking time. A lot has happened since then.
First and foremost, I moved to campus! Living with roommate Kevin on campus was one of the best decisions I’ve ever made. I discovered new friendships and deepened existing ones; I got my first taste of true independence (and of few other things too); I explored Berkeley and the Bay.
And, the best part of it all? I didn’t lose my edge. I added a few new commitments to my schedule: a research group, an internship, a few competitions and clubs, a heavier courseload. As a result, a few updates to my time tracker were in order.
Now that I’m back and settled in, I wanted to do a little reflection. Without another 150 days or so of data, I wanted to see how moving to campus impacted my time allocation and mood. So, let’s revisit those same old questions:
- What am I doing with my time?
- How do my commitments trade off with one another?
- What does that mean for my mood?
Template
Before we dive in, I want to share my new time tracking template. Press “File” and “Make a copy” to start your own tracker.
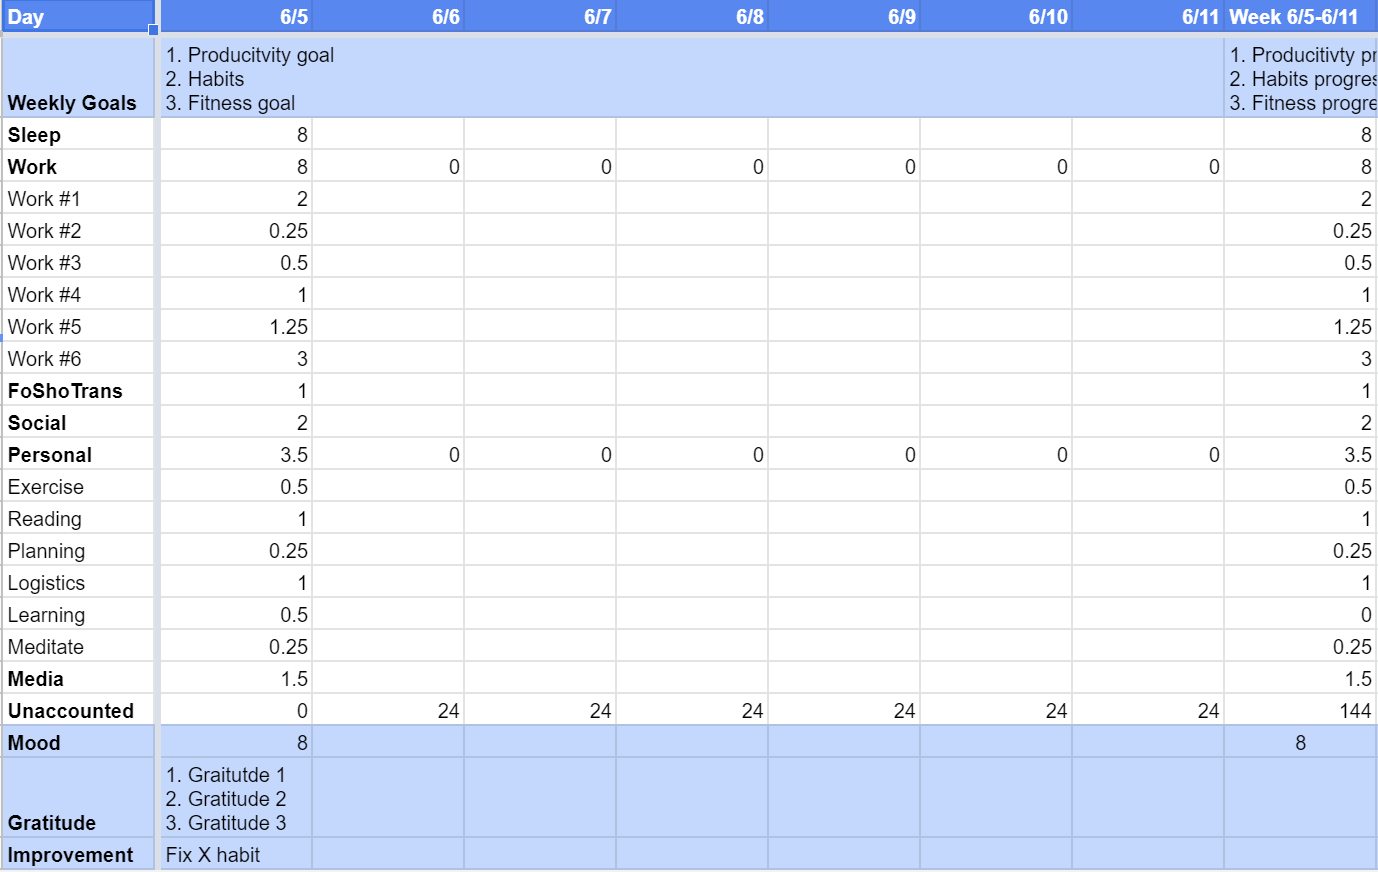
There’s a few things I added:
- I added a Gratitude section. Each day, write down three things you’re grateful for.
- There’s a day-to-day Improvement section, for things you’d like to do better tomorrow.
- I rearranged some of the categories and added new ones. More on those later.
Dataset
The new dataset spans from September 19th, 2020 to June 17th, 2021. It spans 272 days and over 6,000 day-activity observations. Each day is broken down into the broad buckets of sleep, work, food/shower/transportation, personal, and media.
Work is subdivded into classes, debate (club, coaching, writing briefs), Voyager, clubs (e.g. BER, Daily Cal, UPE), internships, competitions, research, recruiting, blogging, and tutoring. Personal comprises planning, reading, meditating, socializing, and exercising.
Some notable changes since last time:
- For completeness, I retroactively recategorized “miscellaneous” and “personal” work as blogging and renamed “professional” to “recruiting.”
- In February, I started tracking logistics (errands or chores) and in June, I created a new category for learning (productive media, like podcasts). I grouped these with planning and media, respectively.
Here are the updated summary stats. Each of these categories is roughly normal.
| N | Missing | Mean | SD | Min | Q1 | Median | Q3 | Max | |||
|---|---|---|---|---|---|---|---|---|---|---|---|
| Sleep | 272 | 0 | 8.00 | 1.39 | 3.5 | 7.25 | 8.00 | 8.75 | 12.25 | ||
| Work | 272 | 0 | 8.43 | 3.07 | 0.0 | 6.75 | 8.75 | 10.50 | 16.00 | ||
| Class | 272 | 0 | 1.70 | 1.97 | 0.0 | 0.00 | 1.00 | 2.88 | 11.25 | ||
| Debate | 272 | 0 | 2.23 | 2.57 | 0.0 | 0.00 | 1.50 | 3.25 | 13.75 | ||
| Voyager | 272 | 0 | 1.72 | 2.12 | 0.0 | 0.00 | 1.00 | 2.50 | 13.00 | ||
| Clubs | 272 | 0 | 0.44 | 0.95 | 0.0 | 0.00 | 0.00 | 0.50 | 6.75 | ||
| Internship | 272 | 0 | 0.25 | 0.92 | 0.0 | 0.00 | 0.00 | 0.00 | 6.50 | ||
| Competitions | 272 | 0 | 0.25 | 1.07 | 0.0 | 0.00 | 0.00 | 0.00 | 8.75 | ||
| Research | 272 | 0 | 0.30 | 0.79 | 0.0 | 0.00 | 0.00 | 0.00 | 4.75 | ||
| Recruiting | 272 | 0 | 0.59 | 1.08 | 0.0 | 0.00 | 0.00 | 0.75 | 7.50 | ||
| Blogging | 272 | 0 | 0.57 | 1.24 | 0.0 | 0.00 | 0.00 | 0.50 | 7.75 | ||
| Tutoring | 272 | 0 | 0.38 | 0.62 | 0.0 | 0.00 | 0.00 | 0.75 | 3.00 | ||
| FoShoTrans | 272 | 0 | 1.53 | 0.80 | 0.0 | 1.00 | 1.50 | 2.00 | 7.50 | ||
| Exercise | 272 | 0 | 0.95 | 0.75 | 0.0 | 0.50 | 0.75 | 1.50 | 3.50 | ||
| Reading | 272 | 0 | 0.80 | 0.80 | 0.0 | 0.25 | 0.50 | 1.25 | 5.00 | ||
| Social | 272 | 0 | 2.73 | 3.15 | 0.0 | 0.50 | 1.75 | 4.00 | 17.50 | ||
| Planning | 272 | 0 | 0.51 | 0.59 | 0.0 | 0.25 | 0.25 | 0.75 | 4.00 | ||
| Meditate | 272 | 0 | 0.17 | 0.15 | 0.0 | 0.00 | 0.25 | 0.25 | 0.50 | ||
| Media | 272 | 0 | 0.88 | 0.77 | 0.0 | 0.25 | 0.75 | 1.25 | 4.25 | ||
| Mood | 272 | 0 | 6.43 | 1.63 | 2.0 | 5.00 | 7.00 | 8.00 | 10.00 | ||
| Personal | 272 | 0 | 2.44 | 1.33 | 0.0 | 1.50 | 2.50 | 3.25 | 8.25 |
One thing that caught my eye right away: shockingly, both my mean and median sleep time are exactly 8 hours. But, from the 25th and 75th percentiles, you can tell that the standard deviation is well over 1 hour. That’s why I don’t feel like I’m well-rested.
Work, Sleep, Social
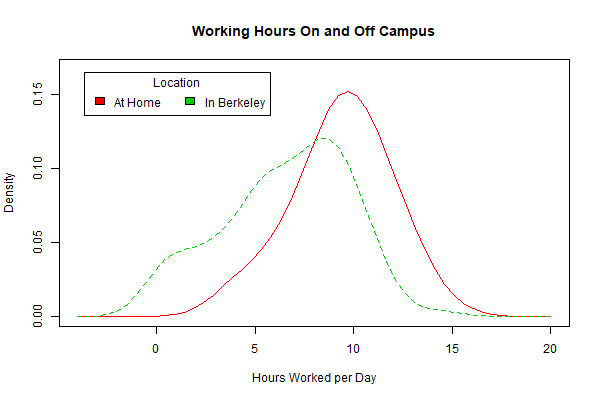
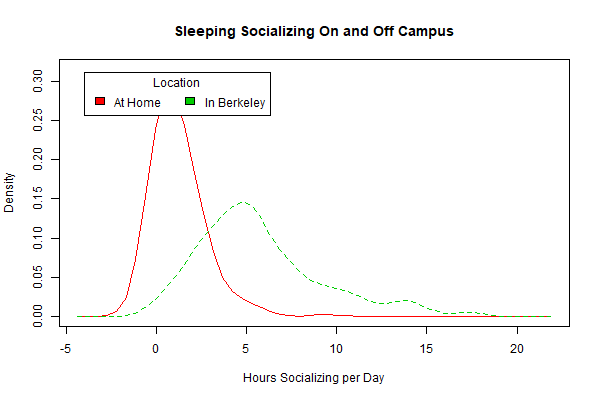
I suspected that I worked and slept less, while socializing a whole lot more. To test this, I added a flag for the days that I was on campus—March 1st to May 30th—and made smoothed histograms for each category.
The results were as expected. There was a sizable decrease in work hours, with a notable bump in days where I did no work at all (imagine!).
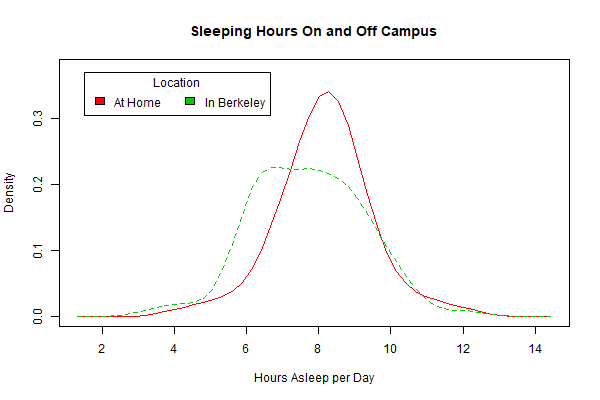
Sleep was a different story. I seemed to get less sleep overall, but there was also much more variation. At home, I got a little over eight hours each night with fairly little deviation. In Berkeley, I seemed to hover uniformly between 6 and 9 hours of sleep each night.
The biggest difference by far was social time. I socialized a lot more on campus, with an apparent mode at around 5 hours. There were definitely also full days that I spent with friends, which just didn’t happen at home.
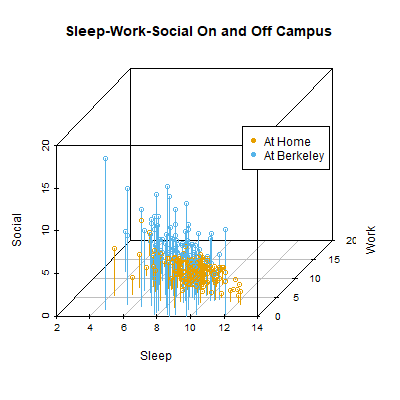
Here’s a 3D scatterplot of these three elements. You can tell that I socialized way more at Berkeley, and that there seems to be a tradeoff between each. The old adage is right: sleep, good grades, and friend—you get to pick two.
Time Series
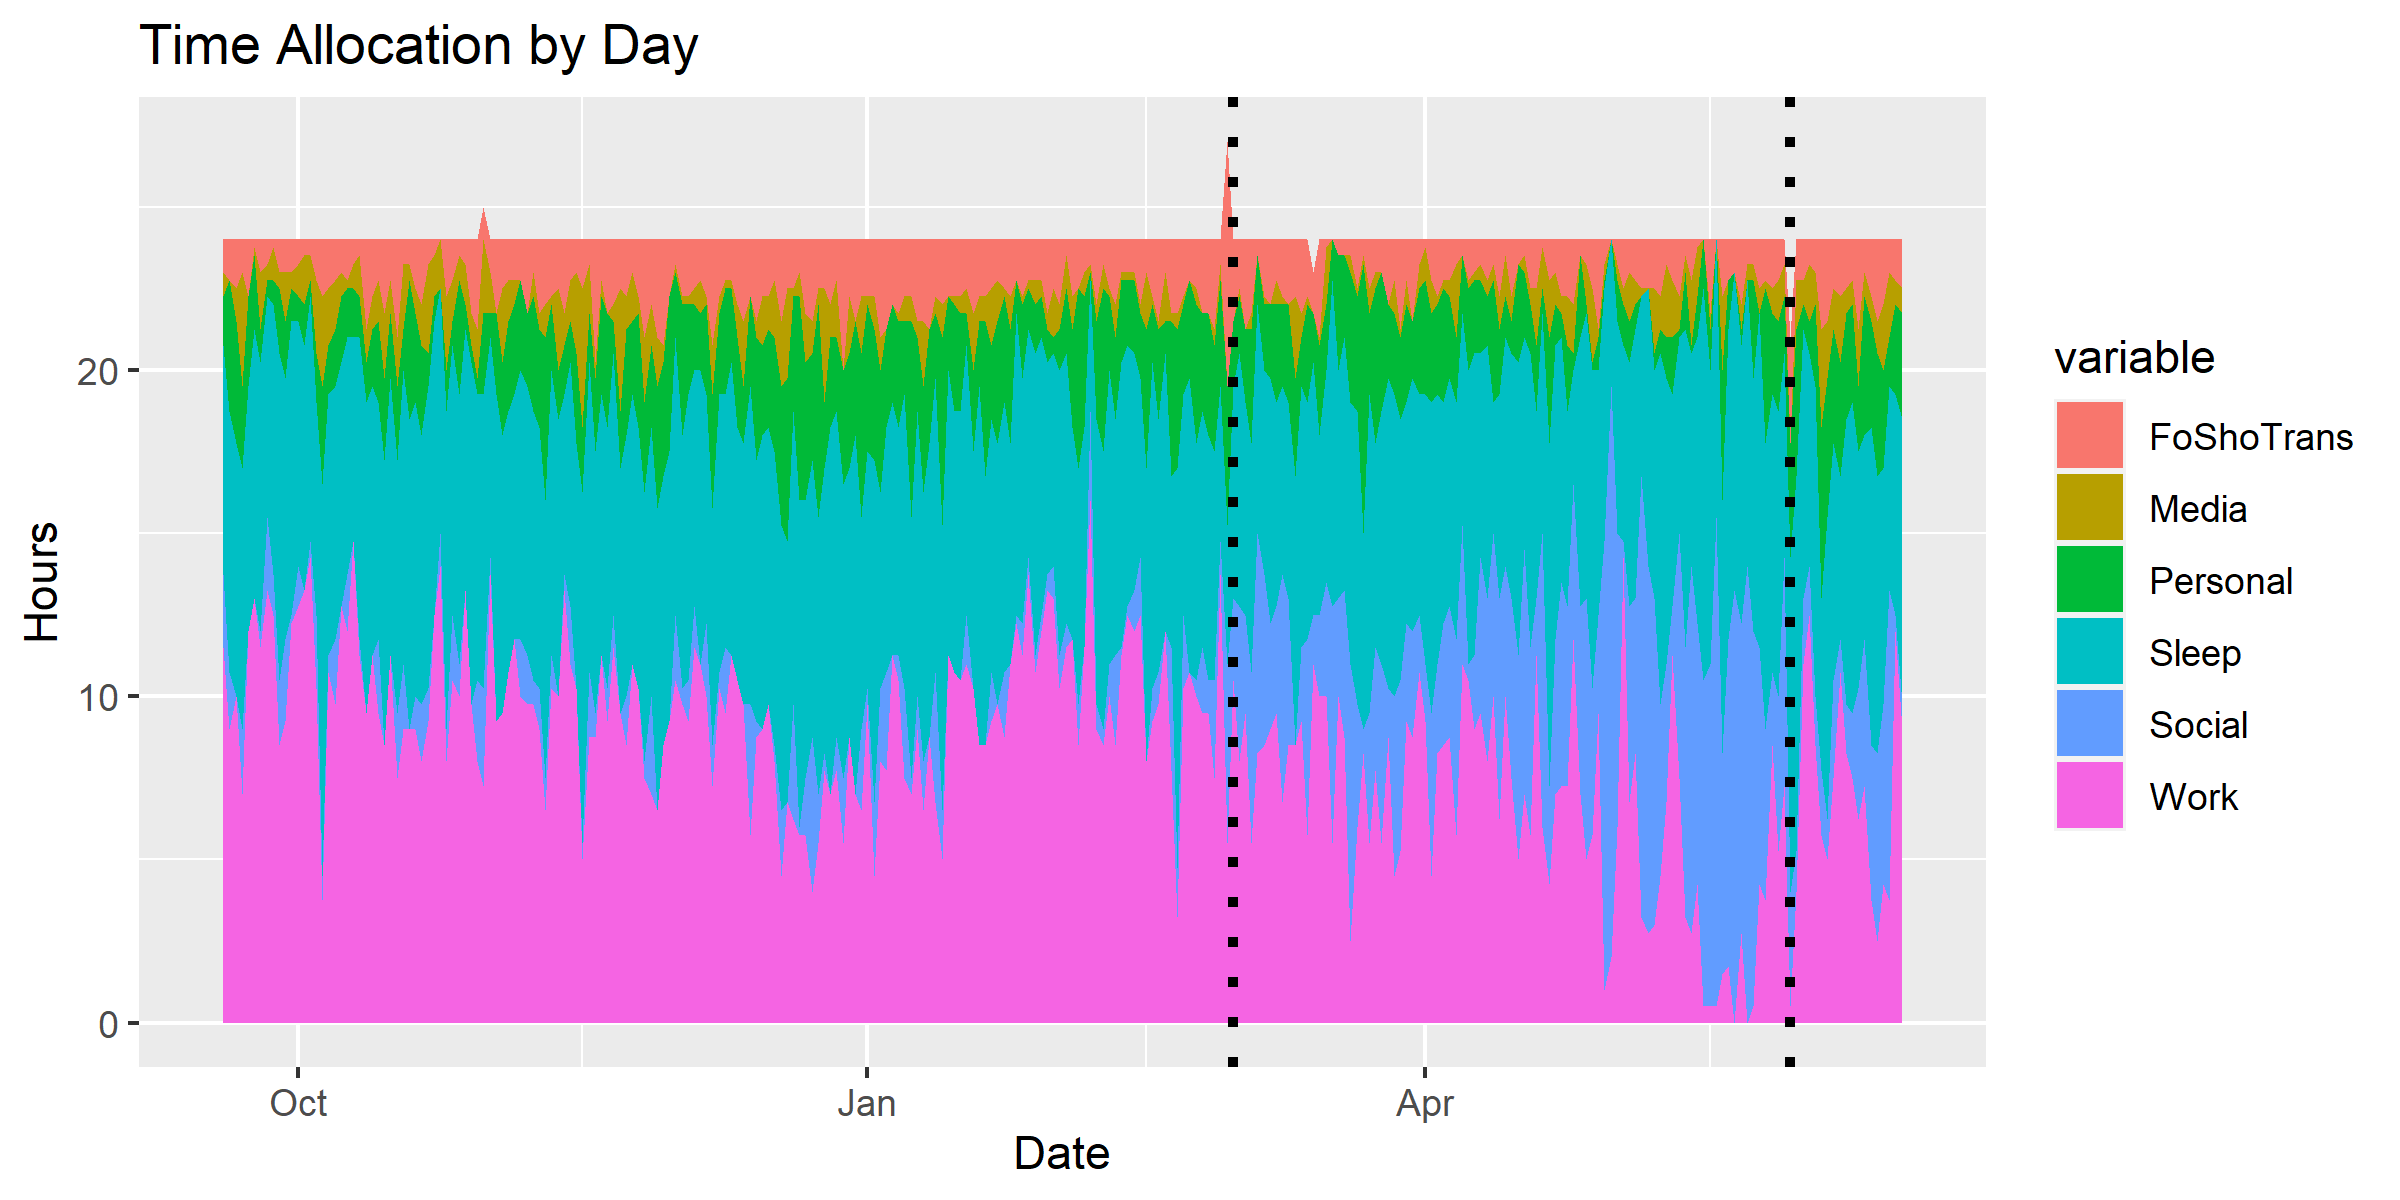
We don’t have to look at just on or off campus either! With our sizable timespan, we can look at meaningful depictions of how my time allocation changed over time. Below is a time plot where each sliver represents one day. One thing to note: the little bumps are daylight savings (the one hour bumps) and changing coasts (the three hour bumps). Clearly, there’s a whole lot of noise.
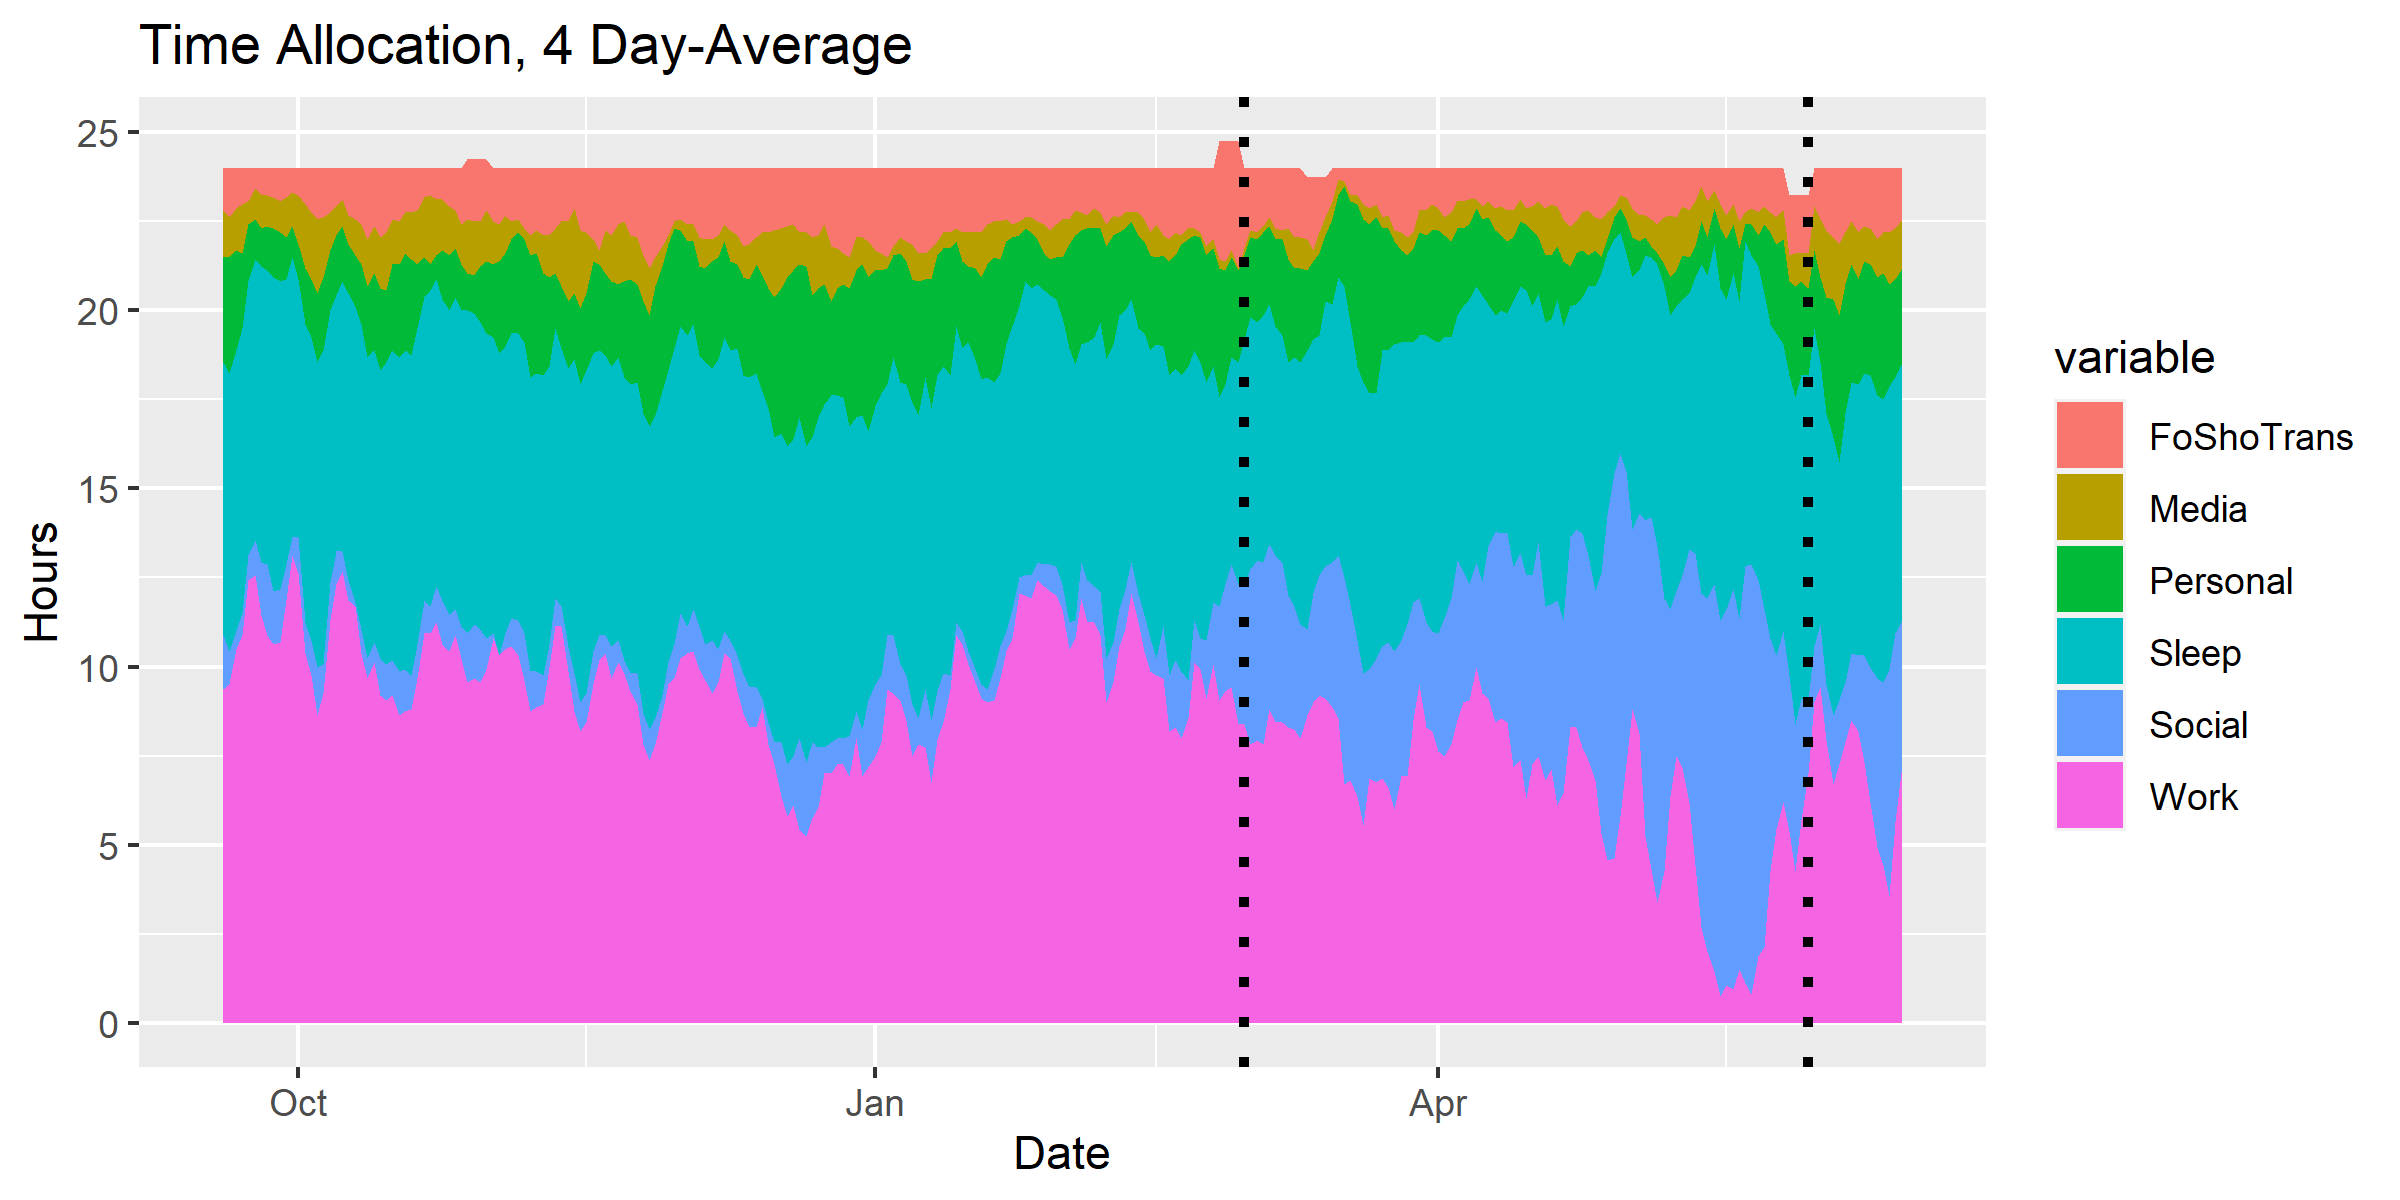
To fix that, I computed the 4-day moving average for each time category, which smoothed out the graph significantly. Some observations:
- Contrary to my expectations, I spent less time per day on food, shower, and transportation when I was on campus.
- You can see the huge increase in social time, especially during deadweek (Berkeley’s study week before finals) and after finals. During those same periods, I spent a lot less time exercising, meditating, and planning, hence why the personal category fades away.
- My work dipped a bit during winter break, declined while on campus, and then fully disappeared after finals.
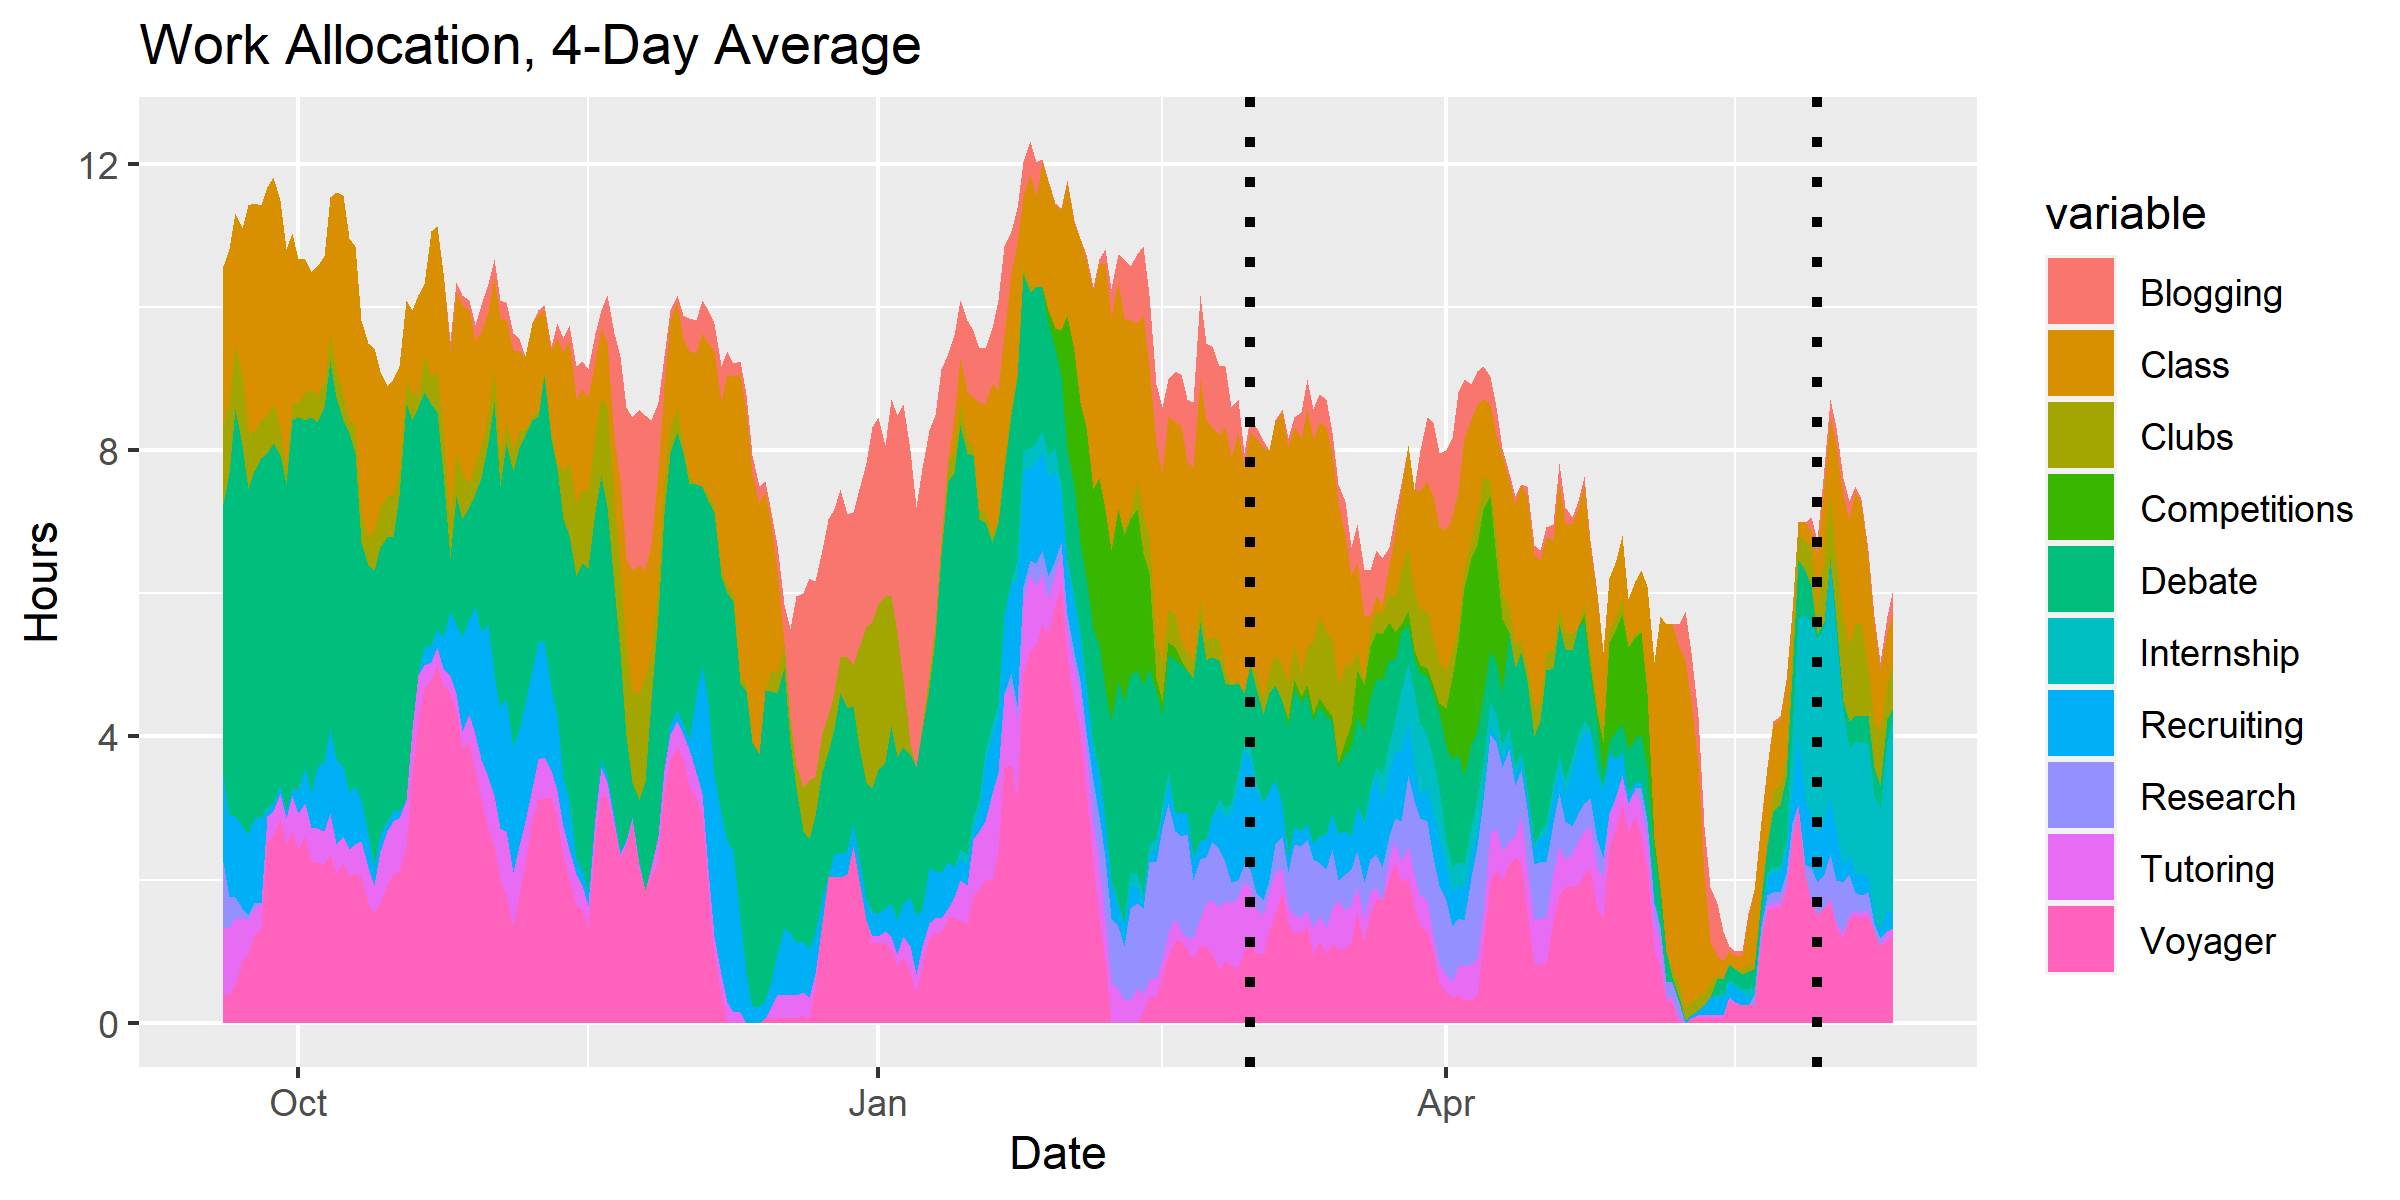
I made another a graph with just the breakdown of my work commitments. A couple trends stood out:
- My commitment to debate faded away across the year. Good riddance.
- The time commitment for Voyager is large and highly seasonal: project crunch times (midpoints and finals) and recruitment yield large spikes.
- I spend fairly little time on classes. From the graph (and the summary stats), I seem to spend less than two hours a day, on average, doing classwork. That’s exciting: if I scaled back my other commitments, I could be taking a whole lot more units.
- I blogged a whole lot during winter break, but then it only popped back up in spurts. Bring back the good ‘ole days!
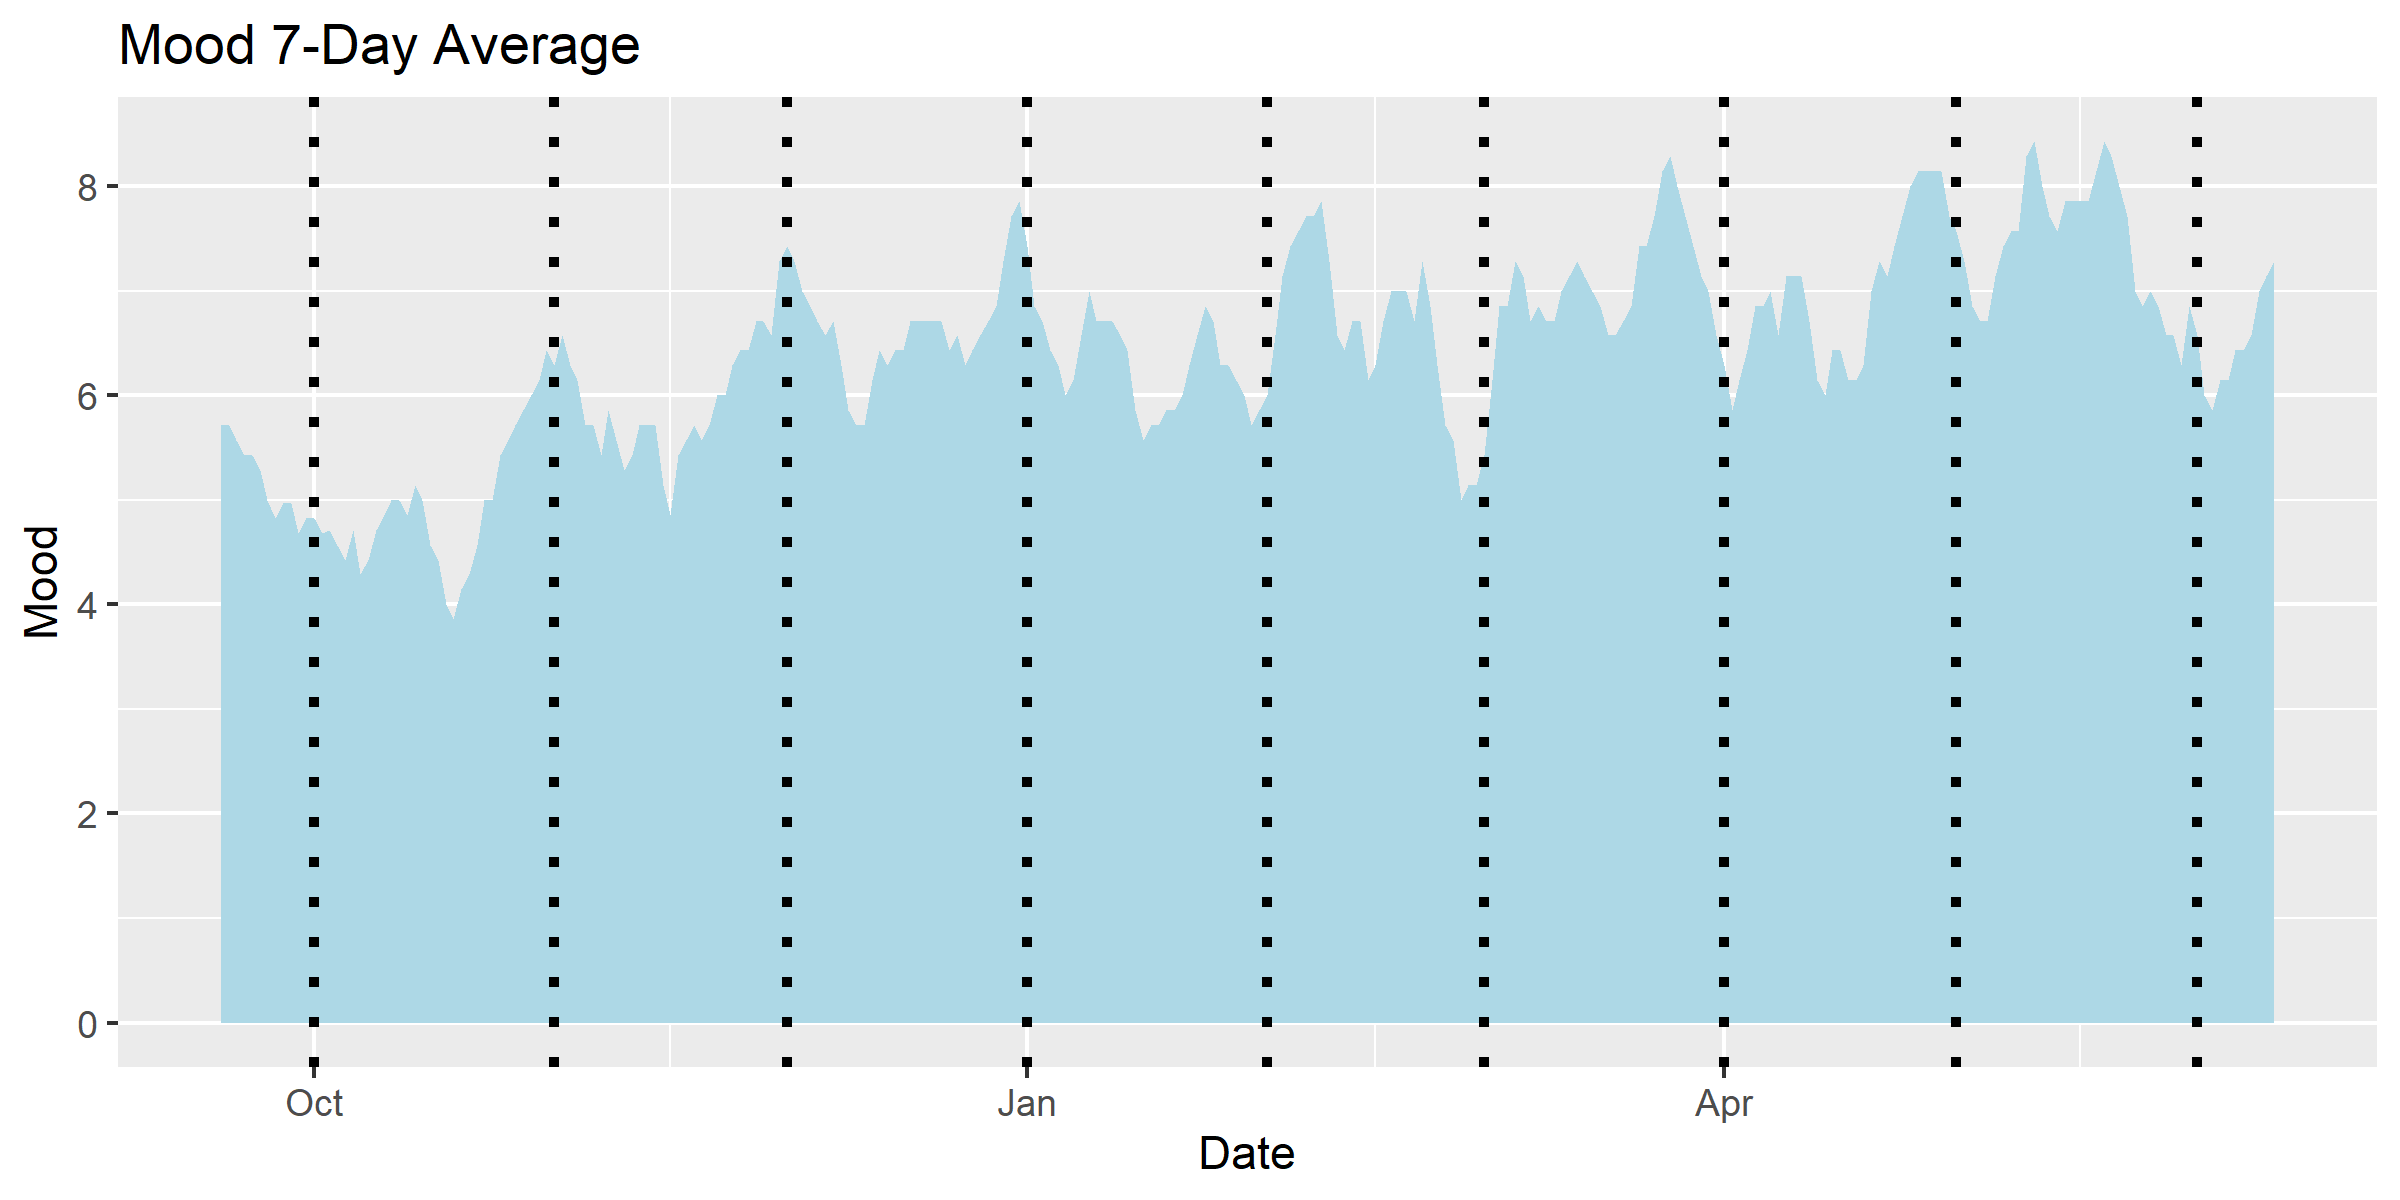
Mood
The last time plot was a smoothed plot of my mood. I added vertical lines to mark the start of each month. Two big trends:
- My mood seems quite cyclical. It’s high at the start of each month, and then dips towards the middle. That’s with, of course, the exception of May.
- My overall mood is angled upward. There was certainly a dip after moving back, but it’s back on the up-and-up! That’s good news.
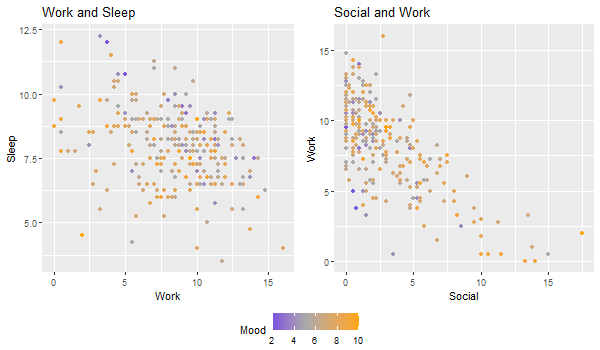
What’s driving these trends? I remade two of the scatterplots from the first time tracker post. The first shows that there’s no clear relationship between sleep and work. It also seems that the worst days are the ones where I work and sleep a lot. That’s no surprise at all: the rest of life is all the fun stuff. The second scatterplot shows a fairly stark tradeoff between social time and work (which makes sense, as sleep is a lot less flexible). It also shows that on the days where I socialize a lot, I’m almost always very happy. The worst days involve little social time with not much work to compensate.
Of course, these are just guesses. I redid the regression analysis from the last post with models based on components of habits and work. The results are below.
| Habits | Work | |||||
| (Intercept) | 5 | . | 978*** | 6 | . | 854*** |
| (0 | . | 294) | (0 | . | 286) | |
| Reading | 0 | . | 117 | |||
| (0 | . | 122) | ||||
| Planning | 0 | . | 287 | |||
| (0 | . | 157) | ||||
| Social | 0 | . | 151*** | |||
| (0 | . | 033) | ||||
| Exercise | -0 | . | 055 | |||
| (0 | . | 139) | ||||
| Media | -0 | . | 407** | |||
| (0 | . | 123) | ||||
| Meditate | 1 | . | 194 | |||
| (0 | . | 677) | ||||
| Class | -0 | . | 033 | |||
| (0 | . | 054) | ||||
| Voyager | -0 | . | 061 | |||
| (0 | . | 048) | ||||
| Debate | -0 | . | 178*** | |||
| (0 | . | 041) | ||||
| Clubs | 0 | . | 240* | |||
| (0 | . | 103) | ||||
| Internship | 0 | . | 040 | |||
| (0 | . | 108) | ||||
| Competitions | 0 | . | 156 | |||
| (0 | . | 090) | ||||
| Research | 0 | . | 117 | |||
| (0 | . | 123) | ||||
| Recruiting | -0 | . | 040 | |||
| (0 | . | 091) | ||||
| Blogging | 0 | . | 041 | |||
| (0 | . | 083) | ||||
| Tutoring | -0 | . | 152 | |||
| (0 | . | 155) | ||||
| R-squared | 0 | . | 163 | 0 | . | 138 |
| adj. R-squared | 0 | . | 144 | 0 | . | 105 |
| p | 0 | . | 000 | 0 | . | 000 |
Significance: *** = p < 0.001; ** = p < 0.01; * = p < 0.05 | ||||||
This roughly validates what I expected. Social time has a highly significant uplifting effect on my mood. Meditation has a positive effect, but it’s not quite significant. Media, of course, has a large negative effect.
Meanwhile, debate has a corrosive effect on my mood. I seem to enjoy clubs, which makes sense if they’re moreso social activities. Other activities with positive coefficients are internships, research, and (yay!) blogging.
Conclusion
I continue to stand by my original claim: time tracking yields benefits through both the process and product. I am much more wary of my time on a daily basis because I’m constantly aware that my day adds up to 24 hours. Through reflections like these, I get an objective, quantifiable resource to figure out what I’ve been doing and how I can do better. If you have questions, add me on Facebook or send me an email.