
E-Debate Update
Published:
I wrote this as an update to the original article about e-debate trends.
Introduction
On an article posted two weeks ago about e-debate trends, Jim Menick made the great observation that considering only the Varsity LD division could overlook the introduction of new JV divisions. He also suggested that PF was growing, which I wanted to quantify.
I updated my dataset to include Varsity, JV, and Novice divisions from LD, PF, and Policy from the same 27 tournaments. USC had both “Rookie CX” and “Novice CX” divisions; I counted both as novice. College Prep and Jack Howe had “Open” but non-TOC bid rewarding LD divisions; I marked these as JV. Some tournaments in the dataset may not offer a bid in Policy or PF; those entries were included nonetheless.
Alta, Apple Valley, Blake, Blue Key, Bronx, College Prep, Cypress, Dowling, Duke, Glenbrooks, Grapevine, Greenhill, JW Patterson, Holy Cross, Isidore, Meadows, Nano Nagle (Voices), Princeton, Ridge, Seattle, Strake, UK, UT, Valley, Yale.
Analysis
1. Participation
There were 5057 entries in 2019 and 5616 entries in 2020—a roughly 10% increase. The average competitor last year entered in 1.5 tournaments; that number is now 1.75.
Here’s the breakdown of entries across different events and divisions in 2019.
| Event | Varsity | Junior Varsity | Novice | All Divisions |
|---|---|---|---|---|
| LD | 2599 | 285 | 416 | 3300 |
| PF | 2489 | 104 | 289 | 2882 |
| CX | 1270 | 11 | 116 | 1397 |
| All Events | 6358 | 400 | 821 | 7579 |
Now, here are the entries for each event and division in 2020.
| Event | Varsity | Junior Varsity | Novice | All Divisions |
|---|---|---|---|---|
| LD | 3054 | 592 | 379 | 4025 |
| PF | 3057 | 571 | 555 | 4183 |
| CX | 1322 | 211 | 294 | 1827 |
| All Events | 7433 | 1374 | 1228 | 10035 |
Total entries increased from 7579 to 10035, which is a 32.4% increase. Every event and division also saw increases, with large gains made in PF (45.1% increase), Junior Varsity (243.5% increase), and Novice (49.5% increase). Menick is right—total entries are growing even faster than I had thought, and it’s driven in large part by JV divisions.
Speaking of which, tournaments are adding tons of new divisions. Although Duke, Heritage, and Holy Cross, and Seattle Academy scrapped their novice divisions, other tournaments added a combined 39 new divisions, 22 of which were JV divisions.
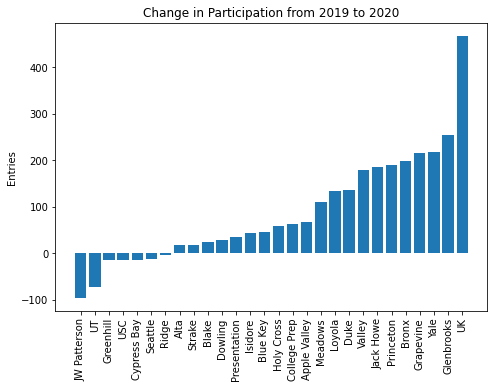
2. Tournaments
After considering more events and all divisions, overall participation seems to be rising for more tournaments. Princeton and Bronx are among the top 6 winners after factoring in other divisions. UK, meanwhile, has soared in participation by introducing four new divisions.
3. Demographics
The demographic trends from the origin article are exacerbated after considering other events and divisions.
First, wealthy coastal states once again seem to be doing the best. Massachusetts, New York, and Texas saw entry increases of 217, 208, and 124, respectively. My home state, Maryland, saw a surprising increase of 119 (good job MoCo!). Arizona and New Jersey saw similarly large increases. Less wealthy states seem to be doing worse, with declines in Kansas, Louisiana, Missouri, , Nebraska, Oklahoma, and South Dakota.

Second, geographic diversity continues to grow. Tournaments hosted debaters from 13.07 states in 2020—that has now grown to 23.46, a bigger absolute jump than before. Similarly, the average distance increased from 572 miles to 1059 miles. Once again, an even bigger gap.
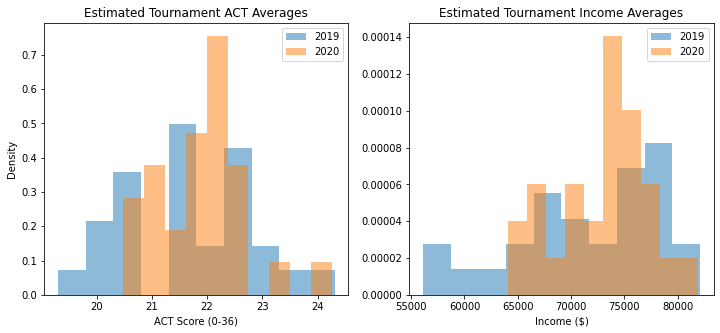
Third, gaps in income and education level have become much more significant. Previously, there was only a small increase in both measures, and the difference in ACT average was not statistically significant. This time, the increase in ACT score is 0.145, and the increase in household income is $1053. The changes in ACT score (p<1.37*10-7) and income (p<3.42*10-12) are highly, highly significant. Even by the roughest measures, debate seems to be getting more privileged.
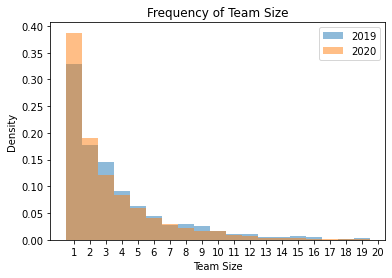
Finally, teams are, once again, getting smaller. Naturally, the cross-event team size is larger than the size for an individual event. In 2019, the average tournament entry had 3.18 teammates. In 2020, they had 1.86 teammates. The percentage of lone wolves entries also increased dramatically, from 26% to 40%. This is a surprising jump: here, being a lone wolf means there are no other entries from your school in any debate event.
Conclusion
Expanding the dataset to include more events and divisions confirms that there are similar participation increases across events and divisions. It reveals that overall rises in entries are driven in large part by the introduction of JV and novice divisions. Simultaneously, it confirms that geographic, socioeconomic, and team composition trends are even stronger than suggested previously.